por Ignacio Arnaiz | Mar 31, 2019 | Sin categoría
In a previous post I indicated the ease of creating a Local IDE in urbiThings.
Well it is so simple that I have created a Local IDE for each municipality and province of Spain, in the next few days I will also do it for all of Brazil and the rest of Central and South America.
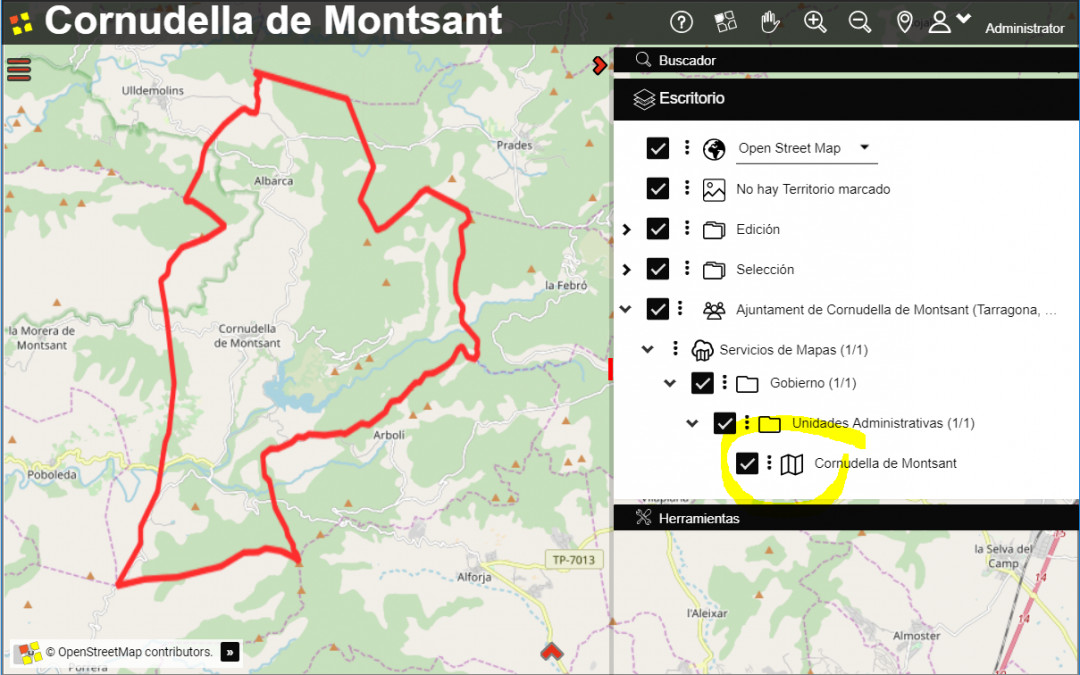
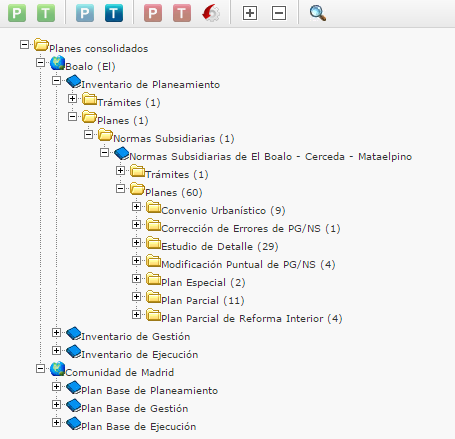
In this file: websites_urbiThings_España indicated the URL assigned to each of these Local IDE
In each Local IDE I will create an access to national layers of great interest such as the Cadastre or PNOA or any of the thousands of layers of interest that already exist in the urbiThings Catalog (suggestions are allowed).
If the municipality or province has their own maps and are already registered in the urbiThings Catalog, they will also be presented at the Local IDE Desk. Such is the case of IDE’s such as Melilla (http://urbithings.com/Melilla.maps) or Cuenca (http://urbithings.com/Cuenca.maps) and many others.
If the municipality or province they consider it useful and convenient to use this urbiThings service as their Local IDE can do it immediately and without any cost. To take control of your IDE just have to ask us by mail to [email protected] that we create an Account and Administrator Access indicating contact information or make a request for a new Account in the left menu of urbiThings.
From that moment they can include new or their own maps in their Local IDE, they can create their own maps classification, change the header or even the colors of the presentation panels. No cost, immediately, flexible.
Devote your time and resources to create content, we take care to publish them.
Ignacio Arnaiz Eguren
Director
por Ignacio Arnaiz | Mar 21, 2019 | Sin categoría
When a web page needs to display a map, it is usual to go to Google or a similar platform of global maps. All of them provide an iframe window where your cartographic background is displayed with the global extension and position that the user needs.
In urbiThings we can do the same, but with some differences:
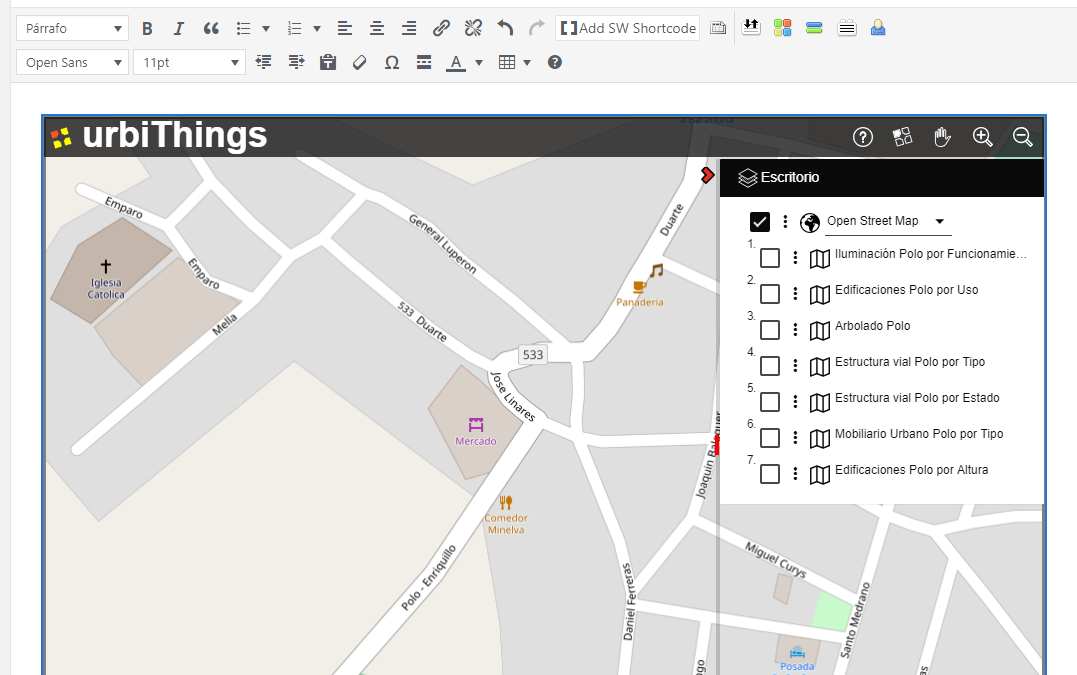
It is not necessary to limit oneself to the cartographic background provided by the platform on duty. In urbiThings we propose a wide selection of funds and let the end user choose the most convenient one
We can also include in the embedded window the maps that we create can be more useful to view from our website. Maps that may have been created on the urbiThings platform or reused any of the almost 700,000 maps already accessible from urbiThings
To embed a window it is not necessary to have a KEY API and there is no limitation in the number of embedded windows
To embed a urbiThings window, just follow a few simple steps:
- Have an account in urbiThings (remember that it is free and to request it you only need to provide a verifiable email account)
- Create and save a selection of maps. This selection will be the one that urbiThings will show in the embedded window.
- The selection can have as many maps as desired, but it is recommended that they be five or six at the most. To show many maps it is better to create an account WEB site as explained in the previous post.
Ask urbiThings the HTML code of the embedded window indicating the selection of maps to present and the dimensions of the embedded window. urbiThings will copy the code to the clipboard
- Paste that code on our page and you’re done
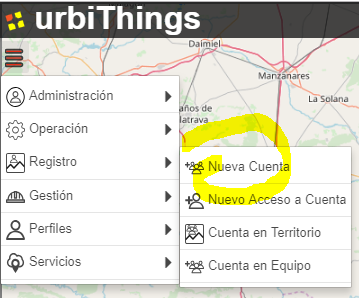
STEP 1 – REQUEST AN ACCOUNT
Enter urbiThings.com and in the menu on the left select the option «Account Registration». With indicating a mail account is enough. Once sent you will receive an account verification email and acceptance of the conditions of service. When the registration request is accepted by urbiThings you will receive a welcome email.
This operation creates an Organization Account and Access to that account with Account Manager profile. With this profile you can add to the Account how many Accesses you need without limitation, each Access represents a user of your organization.
From that moment you can start sessions in urbiThings and have access to create Selections and get your HTML code to embed it in your web.
STEP 2 – CREATE A SELECTION
The map selection will be the one shown in the embedded window.
In previous posts of this blog you can see how to create new maps from data sets or reuse maps provided by other organizations in open formats and with open use licenses. There are almost 700,000 maps available and each Account can create its own maps.
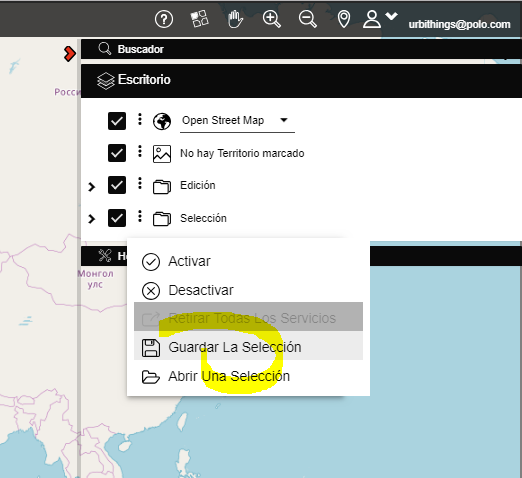
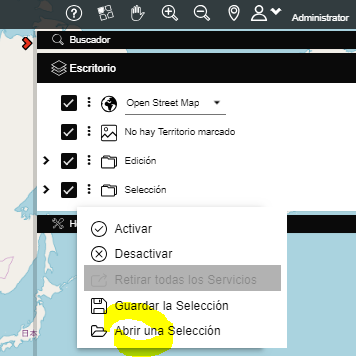
When a map is visible on the Desktop it can be selected and it will be moved to the Selection node, once the set of maps that will form that Selection is saved in the profile of the Account using the option «Save Selection» in the node of «Selection» of the «Desktop» panel
STEP 3 – OPEN A SELECTION
The selection of maps that we have saved in the previous step must be opened in order to use it in several ways:
- To open it when we want to see those maps again on the urbiThings Desktop
- To share it, either as a URL that urbiThings copies to the clipboard (Copy Direct Access) and allows you to start urbiThings with that selection open, or as a text file (Export selection) that contains the list of maps that form the selection and that can be used to recreate it (Import selection).
- To use it as map sources in an embedded window (Copy HTML) that will be the function that we will use in this case.
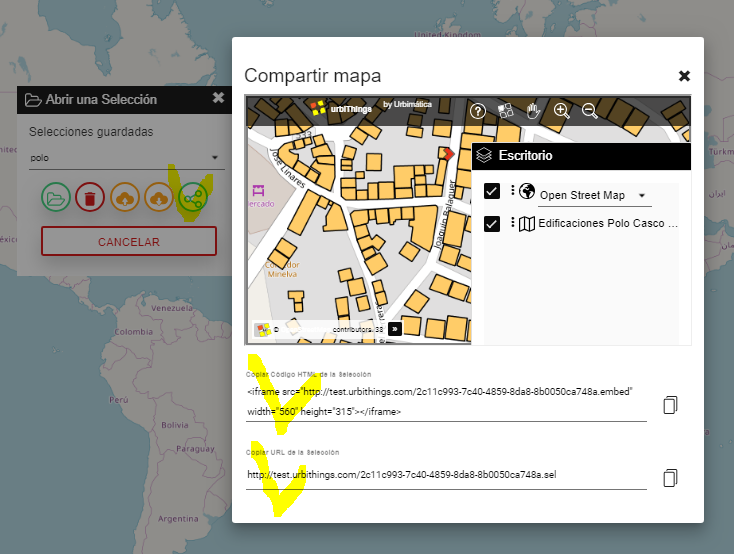
STEP 4 – COPY HTML
Select the previously saved Map Selection with the dropdown of saved selections. Once indicated, press the share button and the system presents the two sharing options:
- As a direct access URL to the selection, so that it can be sent to another user and start urbiThings with the chosen selection
- As an HTML code to embed in our website. In the code you can adapt the width and height of the window to the needs of our website
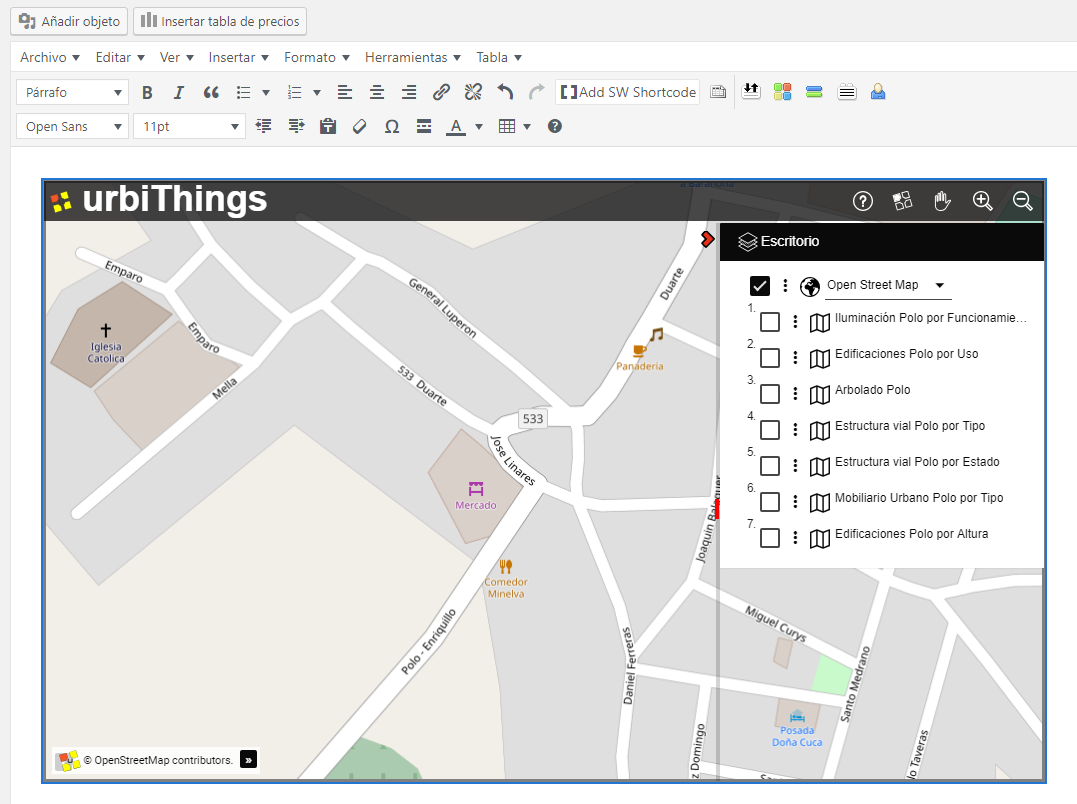
STEP 5 – PASTE HTML
The HTML code copied on the clipboard must be inserted in the corresponding web page:
<iframe src=»http://urbithings.com/757ef2a47-8057-4237-a451-29d3838ae600.embed» width=»1000px» height=»600px»></iframe>
CONCLUSION
Embedding our maps created in urbiThings on a WEB site is simple, free and flexible. Without a doubt an excellent option to add spatial information on the Internet.
Ignacio Arnaiz Eguren
Director
por Ignacio Arnaiz | Jul 27, 2012 | Sin categoría
When they were supported on paper, interpretation process used to determine the type of objects by a description graphic language based on colors, half-tones or line types, going along with strategically located texts. Their manual use required the maps to be composed of manageable sheets.
On that cartographic base, visible components, like buildings, roads, closures or crops are certainly obtained, because of their stereoscopic nature or the radar technique used, although terrain modeling can be also obtained through isolines. Indeed, this may also be considered as a reference basis for multiple thematic goals –physical environment, land registry, urban planning, facilities…, having been built by different research techniques, design or territorial analysis (usually using semi-transparent support materials and realigning.)
CAD and GIS systems popularization required digital cartographic support types, digitizing paper support pieces first and using restitution process directly then. For many years, this digitalization process did not make any major changes and sheets were still used. New systems, of course, made this work easier, enhancing more accurate and high-quality results, but work methodology was not affected and no new functionalities were introduced, especially because they were still sophisticated means for… producing paper!
So here we are now, although some features have been improved:
- Basic mapping has become digitally continuous, being the basis of accurate reference information for other more specialized or sectoral analysis and acquisition processes –GIS do not only provide slides, but also a much more powerful spatial analysis.
- Distinctly accurate maps are not superposed any more, as they used to be. Mainstreaming processes may automatically keep low accuracy layers from high accuracy layers –some limits are stated, but I personally think that the duplication of efforts arises from competency or coordination weakness. The expanding economic crisis will be indirectly positive in a way mapping expenditure will be rationalized.
- The model based on line coding is being replaced by object coding-based models. This is a very difficult and low-standardized change.
- New cheap and efficient geographical information systems have been released, as well as new GIS standards letting you SHARE. Mapping world has traditionally never been incredibly generous –I do still remember when IGN pretended to charge a large amount for one DXF containing municipal boundaries done to scale 100.000!
- GPS systems are universally used, allowing elements can certainly be geo-referenced without any sophisticated measuring and geodesy process.
- Valuable possibilities about sharing geographical information on the Internet have been demonstrated.
In spite of these circumstances, territorial information systems are applied today not only in technical offices for plan and project production purposes, they have become a general tool used for a wide range of increasingly sophisticated services and contents, either for institutions and the business world and citizens.
This pressure is causing a crisis in the way territorial information is acquired, in treatment and verification systems, in storage systems and, especially, in publication and information access systems.
In the institutional level, this crisis is focusing on special data infrastructures development, a great step further in order to share geographical information, but it should still be improved until a system of systems’ creation, aimed to guarantee a proper integration and update level ensuring its performance in public and business sectors. These data infrastructures engage in competition with commercial mapping structures like Google Maps or Bing Maps, which are platforms achieving their objective by producing an online virtual version of the current world, extremely useful to make business decisions. They prove so useful that their business model is now changing: the free come-on services are becoming payment services, merely commercial products.
Curiously, Achilles’ heel remains data acquisition either for IDE’s and commercial platforms. In this regard, there is not a big change, and basic mapping may be updated by photo-interpretation techniques.
Keeping this method is beneficial because of the constantly increasing resolution of satellite pictures, its lower costs, the possibility to access high volumes of pictures and the improved sensibility of its sensor spectra.
However, photo-interpretation has still some disadvantages –as its name implies, it is an “interpretation” of reality at one point by one person, better or worse qualified for this purpose. Its operating speed applies to campaigns for a particular number of years. It can only produce visible surface structure data that need to be accurate and verified by subsequent field work –this field work is limited to particular verification aspects only, because of its high cost and inefficiency.
Is there any other alternative?
There are three alternatives:
- Re-using digital projects (Geo-transactions), the purpose is treating planning, management, urbanization and construction projects as information resources, so the real world and the virtual world synchronize in an absolutely easier way, although it requires huge efforts according to normalization (CityGML, Urbanismo en Red) and managing this change between professionals and the administration. It allows managing all territorial structures, not only the visible surface ones, so it involves this will certainly be the future system for getting territorial information, sensor-based systems being dedicated to support and verification activities.
- Contribution is a product arising from communication, as Information flows in Internet era have dramatically changed. Collaborative work produces such a multiplier effect on the available information that it quickly renders any other mass information collection and distribution techniques obsolete. Exclusively sharing html information websites has moved to sharing geographical and all sorts of information. That is why managing the global population capacity for efficiently generating “reliable” territorial information remains an essential challenge.
- The ability of elements to turn visible based on assigning a capability to territorial system objects for recognizing themselves and knowing where they are, either they are static and mobile units, and providing this information when required. This is a decisive factor to develop new information systems (Location Services).
On this basis, a foregone conclusion stands: the way geo-references geometric description of things composing our world is acquired must evolve. Remote sensors and interpretation processes will be still used, but new consideration and representation points of view of our world will involve an in-depth checking on how mapping data are represented, stocked, distributed and used.
The description of the world will be managed by the owners of the objects it is composed of and shared through open services. It will be updated by these same changing processes, affecting the real world either, and it will become the support and backbone on which new points of view of the world will be represented, different views that we cannot still imagine, as augmented reality, virtual reality, location services or intelligent territories are only the beginning.
Ignacio Arnaiz Eguren – Innovation Director – Arnaiz Consultores SL
por Ignacio Arnaiz | Jul 27, 2012 | Sin categoría
According to one of my previous post (Collaborative City), the real change on how we interact with the city will come when we will be able to establish a dialog with it or its parts. The city will have become then a sensitive entity being able of taking decisions, performing and communicating, due to an intelligence distribution and calculation capacity process among all its components. (más…)
por Ignacio Arnaiz | Jul 27, 2012 | Sin categoría
I said in a previous post about Digital planning that the Spatial planning must be the revised result of the transactions which are carried out there by the digital plans approved. This transformation of the plans into transactions is called Systematization (we will talk much more about systematization). Well, both digital plans and the revised spatial planning must be recorded in a data base that we denominate Digital Recording of Planning.
(más…)
por Ignacio Arnaiz | Jun 21, 2012 | Sin categoría
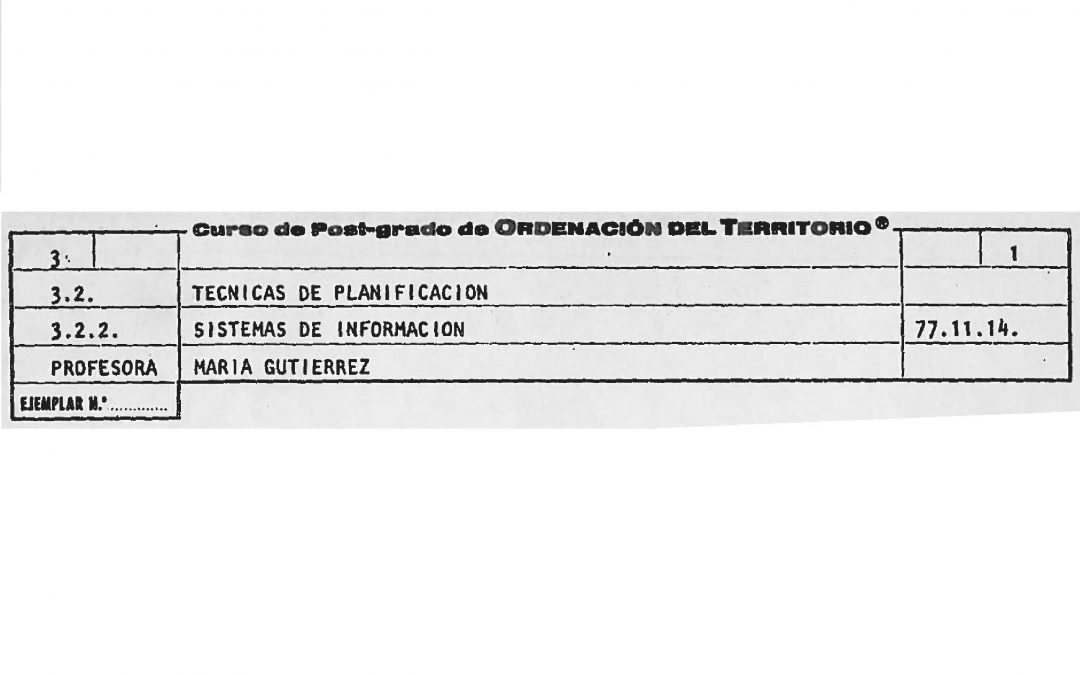
I remember the documentation of a postgraduate course on Planning Techniques where the topic of the day was Information Systems. A course taught by Maruja Gutiérrez-Díaz in 1977. (Maruja is nowadays an innovation consultant after many years working for the European Commission and 15 years in charge of the Regional Information Center in Madrid, which was a pioneering center in digital documentation already in 1973). (más…)